The 2021 RV industry didn’t just grow; it shattered every previous record, shipping a mind-boggling 60,240 units and proving that the open road is more popular than ever. Our deep dive into Rv statistics 2021 reveals that this wasn’t a fluke, but a historic surge driven by a 91.5% explosion in Class B van sales and a massive influx of first-time Millennial owners.
Imagine walking into a dealership in 2021 only to find empty lots and waiting lists stretching six months long. That was the reality for millions of Americans who suddenly realized they needed a self-contained bubble to travel safely. The numbers tell a story of a market that completely rewrote the rules of the road, turning camping from a niche hobby into a mainstream lifestyle.
Key Takeaways
- Record-Breaking Volume: 2021 saw 60,240 wholesale RV shipments, surpassing the 2017 record by 19%.
- The Van Revolution: Class B motorhomes led the charge with a staggering 91.5% increase in shipments.
- New Demographics: 31% of all buyers in 2021 were first-time owners, signaling a major shift in who is hitting the road.
- Supply Chain Reality: Despite record demand, inventory shortages and parts delays defined the year, driving up prices and wait times.
- Towable Dominance: Towable RVs continued to rule the market, accounting for over 90% of all units shipped.
Table of Contents
- ⚡️ Quick Tips and Facts
- 📜 The Wild Ride: A Brief History of RV Popularity Leading to 2021
- 📊 2021 RV Industry Statistics: The Numbers That Shook the World
- 🚐 Motorhome Market Data: Class A, B, and C Breakdown
- 🏕️ Towable RV Statistics: Travel Trailers, Fifth Wheels, and Pop-Ups
- 🏠 Park Model RVs: The Tiny Home Boom in 2021
- 🌍 Geographic Distribution: Where Did Americans Camp in 2021?
- 💰 Pricing Trends and Inventory Shortages: The 2021 Supply Chain Crisis
- 👥 Demographic Shifts: Who Was Buying RVs in 2021?
- 🛠️ New vs. Used: Sales Volume and Market Dynamics
- 📉 Wholesale Shipments vs. Retail Deliveries: Decoding the Data
- 🔮 Future Outlook: What 2021 Data Predicts for the Next Decade
- 🧠 Conclusion
- 🔗 Recommended Links
- ❓ FAQ
- 📚 Reference Links
⚡️ Quick Tips and Facts
Before we dive into the deep end of the 2021 data ocean, let’s hit the highlights. If you’re skimming for the “wow” factor, here is what you need to know immediately:
- Record-Breaking Year: 2021 wasn’t just a good year; it was a historic anomaly. The industry shipped over 60,0 wholesale units, shattering the previous record set in 2017.
- The Van Boom: If you thought Class A motorhomes were the kings of the road, think again. Class B (Van Campers) saw a staggering 91.5% increase in shipments compared to 2020. They were the undisputed MVPs of the pandemic era.
- Towables Rule: Despite the motorhome hype, Towable RVs still dominated, accounting for roughly 90% of all shipments.
- Supply Chain Woes: While demand was through the roof, inventory was practically non-existent. Dealerships often had empty lots, and waiting lists stretched into months.
- New Faces: 31% of the buyers in 2021 were first-time owners, a demographic shift that reshaped the market.
For a deeper dive into how these numbers compare to the current landscape, check out our comprehensive breakdown on RV Statistics.
📜 The Wild Ride: A Brief History of RV Popularity Leading to 2021

To understand why 2021 felt like the world ended and started all at once for RVers, we have to look at the road that got us here. The RV industry has always been a barometer for the American economy and social mood.
In the post-WII era, the RV was a symbol of freedom and the open road, but it was often clunky and expensive. Fast forward to the 190s and 20s, and we saw a stabilization. The industry grew, but it was predictable. Then came 208. The Great Recession crushed RV sales, and the industry spent years digging out of the hole.
By 2019, things were looking up. But 2020? That was the catalyst. When the world locked down, people couldn’t fly, they couldn’t stay in hotels, and they needed a safe, self-contained bubble. The RV became that bubble.
“The pandemic didn’t just create a spike in demand; it fundamentally altered who was buying and why.” — Industry Analysts, RVIA
We saw a massive influx of Millennials and Gen Z buyers who had never considered camping before. They weren’t looking for a 40-foot luxury palace; they wanted something agile, affordable, and ready for the “work-from-anywhere” lifestyle. This shift set the stage for the 2021 explosion, where the industry had to scramble to build units faster than they could be sold.
📊 2021 RV Industry Statistics: The Numbers That Shook the World
Let’s get down to the brass tacks. The numbers for 2021 are so high they almost look like typos. According to the Recreational Vehicle Industry Association (RVIA), the industry produced a mind-boggling 60,240 wholesale RVs in 2021.
Wait, let’s put that in perspective.
- vs. 2020: That’s a 39.5% increase over the 430,412 units shipped in 2020.
- vs. 2017: It surpassed the previous all-time record (set in 2017) by 19%.
Craig Kirby, the President & CEO of RVIA, noted at the time: “Through their hard work and innovation, our manufacturers and suppliers are rising to meet these challenges, building a record 60,0 RVs this past year, sending more RVs to dealer lots across North America than ever before.”
But here is the kicker: 60,240 is the wholesale number. The actual number of units delivered to consumers (retail) is often higher due to inventory adjustments, but the wholesale figure is the gold standard for manufacturing output.
The Economic Impact
This wasn’t just about selling boxes on wheels. The economic ripple effect was massive:
- Total Economic Impact: The industry generated a $140 billion impact on the US economy.
- Manufacturing Value: Manufacturers and suppliers contributed $73.7 billion.
- Jobs: The sector supported nearly 680,0 jobs with over $48 billion in wages.
If you are wondering how this compares to the “61 RV Industry Statistics” often cited by competitors like Cleango, the consensus is clear: 2021 was the peak of a multi-year boom that started in 2020. While Cleango highlights the long-term trends, the 2021 data represents the absolute apex of demand before supply chain realities began to bite harder in 202.
🚐 Motorhome Market Data: Class A, B, and C Breakdown
Motorhomes are the “self-propelled” heroes of the RV world, but 2021 showed a clear preference for agility over luxury.
The Class B Surge
The Class B (Van Camper) was the undisputed star of the show.
- Shipments: 13,827 units.
- Growth: A jaw-dropping 91.5% increase over 2020.
Why? Because they fit in a standard parking spot, get decent gas mileage (for an RV), and look cool. Brands like Winebago (with their Revel and Solis) and Airstream (with their Basecamp) capitalized on this. If you were looking for a new Class B in 2021, you were likely on a waiting list.
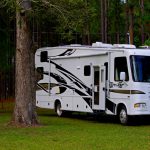
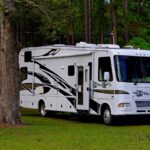
The Class C Stability
Class C Motorhomes remained the workhorse for families.
- Shipments: 27,035 units.
- Growth: 24.7% increase.
These units, with their distinctive “cab-over” bunk area, offered the perfect balance of space and drivability. Brands like Thor Motor Coach and Forest River kept production lines humming to meet the demand from families who wanted a step up from a tent but didn’t want the intimidation of a bus-sized Class A.
The Class A Shift
Class A Motorhomes saw growth, but it was the slowest of the bunch.
- Shipments: 15,350 units.
- Growth: 29.1% increase.
While still strong, the growth rate was lower because the Class A market is more sensitive to economic downturns and gas prices. High-end luxury models from Newmar and Tiffin sold well, but the volume was lower compared to the van craze.
| Class Type | 2021 Shipments | Growth vs. 2020 | Primary Driver |
|---|---|---|---|
| Class B (Van) | 13,827 | +91.5% | Urban adaptability, remote work |
| Class C | 27,035 | +24.7% | Family travel, value |
| Class A | 15,350 | +29.1% | Luxury travel, full-time living |
👉 CHECK PRICE on:
- Class B Vans: RVShare Class B Search | Camping World Class B | Winebago Official
- Class C Motorhomes: RVShare Class C Search | Camping World Class C | Thor Motor Coach Official
- Class A Motorhomes: RVShare Class A Search | Camping World Class A | Newmar Official
🏕️ Towable RV Statistics: Travel Trailers, Fifth Wheels, and Pop-Ups
If motorhomes were the stars, Towables were the engine room. They accounted for a massive 90.64% of all RV shipments in 2021. Why? Because you can park the tow vehicle and drive around town, and they are generally more affordable to buy and maintain.
Conventional Travel Trailers
These are the bread and butter of the industry.
- Shipments: 423,750 units (Note: The aggregate data often cites ~423k for this category).
- Growth: +42.0% vs. 2020.
Brands like Jayco, Keystone, and Forest River dominated this space. The demand was so high that dealers were selling units off the lot before they even hit the floor.
Fifth Wheels
The “luxury” of the towable world.
- Shipments: 107,560 units.
- Growth: +32.0% vs. 2020.
Fifth wheels offer the most living space and stability. They are the preferred choice for full-time RVers and those who want a “home away from home.” If you are interested in exploring this category further, check out our guide on Fifth Wheel RVs and Fifth Wheel RV Manufacturers.
Folding Camping Trailers (Pop-Ups)
The budget-friendly option.
- Shipments: 7,850 units.
- Growth: +26.1% vs. 2020.
While they didn’t see the explosive growth of Class Bs, they still saw a healthy bump as families looked for affordable entry points into the lifestyle.
Did you know? 4 out of every 5 RVs in North America are manufactured in northern Indiana. It’s the “RV Capital of the World,” and in 2021, those factories were running 24/7 to keep up with the orders.
👉 Shop Towables on:
- Travel Trailers: RVShare Travel Trailers | Camping World Travel Trailers | Jayco Official
- Fifth Wheels: RVShare Fifth Wheels | Camping World Fifth Wheels | Keystone Official
🏠 Park Model RVs: The Tiny Home Boom in 2021
Park Model RVs are a unique beast. They are designed for seasonal use, often placed in RV resorts, and are built to mimic tiny homes.
- Shipments: 3,923 units.
- Growth: +5.7% vs. 2020.
While the growth was modest compared to the other categories, it was significant. As the tiny home movement gained traction, more people looked to Park Models as a permanent or semi-permanent solution. Brands like Forest River and Heartland offered models that blurred the line between an RV and a traditional house.
However, the growth was tempered by zoning laws and the fact that these units require a specific type of land placement. They aren’t for the “bondocking” crowd; they are for those seeking a stationary, comfortable retreat.
🌍 Geographic Distribution: Where Did Americans Camp in 2021?
If you were looking for a map of 2021 RV activity, it would look like a heat map of the entire country, but with some hotspots.
- Top States by Sales:
- California: Despite high costs, it remained the top market with $2.4 billion in sales.
- Texas: A massive market for both towables and motorhomes, generating $1.8 billion.
- Florida: The winter haven, generating $1.5 billion.
- Top Destinations:
Great Smoky Mountains National Park: The most popular park, accounting for 7.92% of all overnight RV stays.
Yosemite National Park: A close second, welcoming roughly 250,0 RV visitors.
Death Valley, Olympic, and Zion: These parks saw record-breaking visitation numbers as people sought out nature.
The trend was clear: people wanted to get away from cities, but they wanted to do it safely. National Parks and state parks saw a surge in RV-specific campgrounds being built or expanded to handle the influx.
💰 Pricing Trends and Inventory Shortages: The 2021 Supply Chain Crisis
Here is the story that didn’t make the headlines as much as the sales records: The Supply Chain Nightmare.
In 2021, demand was outpacing supply by a landslide.
- Parts Shortages: A lack of lumber, steel, and even basic electronics (like the chips that run your slide-outs) slowed production.
- Dealer Lots: Many dealerships had zero inventory. If you walked in, you were often told, “We can order one for you, but it might take 6 months.”
- Price Hikes: With low inventory and high demand, prices skyrocketed. A new RV that cost $40,0 in 2019 might have cost $5,0 in 2021.
The “Newbie Attrition” Phenomenon:
Because of the high prices and long wait times, some first-time buyers got frustrated. They bought used units at inflated prices, only to realize the lifestyle wasn’t for them. This led to a secondary market of “almost new” RVs hitting the used market, but even those were selling for more than their original MSRP.
“We saw people buying RVs sight unseen, just to get on the list. It was a seller’s market like we’ve never seen.” — Local RV Dealer, 2021
👥 Demographic Shifts: Who Was Buying RVs in 2021?
The face of the American RVer changed in 2021. It wasn’t just retirees anymore.
- First-Time Owners: 31% of buyers in 2021 had never owned an RV before.
- Age Demographics: Adults aged 18–34 made up a significant chunk of the market. 84% of Millennials and Gen Z owners planned to buy another RV.
- Usage Patterns:
Casual Campers (39%): Used their RVs about 16 days a year.
Full-Time Residents (1.5%): A growing segment, with 70% of this group being female.
Remote Workers: The rise of “work-from-anywhere” meant people were keeping their RVs for longer periods, not just weekends.
This shift forced manufacturers to rethink their designs. We saw more office-friendly layouts, better Wi-Fi boosters, and solar power options becoming standard features rather than upgrades.
🛠️ New vs. Used: Sales Volume and Market Dynamics
The line between new and used blurred in 2021.
- New Sales: Record-breaking, but inventory was scarce.
- Used Sales: The used market saw a slow rebound, but prices were inflated.
- Inventory Levels: The number of used RVs for sale on platforms like RV Trader was about 13% below the levels seen in May 2020.
Why? Because everyone was holding onto their RVs. With the market so hot, owners didn’t want to sell. They were either upgrading to a bigger unit or just keeping their current one as an investment.
This created a vicious cycle: low used inventory drove up used prices, which drove more people to buy new, which strained the new supply chain even further.
📉 Wholesale Shipments vs. Retail Deliveries: Decoding the Data
It’s important to understand the difference between Wholesale Shipments (what manufacturers send to dealers) and Retail Deliveries (what customers actually take home).
In 2021, the wholesale number was 60,240. However, the retail number can fluctuate based on how much inventory dealers had at the start of the year.
- December 2021: Shipments dipped slightly (-0.1% vs. Dec 2020), but the year-end total was still a record.
- The Lag: Sometimes, a unit shipped in December 2021 wouldn’t be delivered to a customer until early 202. This lag can confuse the data, but the overall trend was undeniable: Record Demand.
🔮 Future Outlook: What 2021 Data Predicts for the Next Decade
So, where do we go from here? The 2021 data suggests a few key trends:
- Stabilization: The market will likely cool down from the 2021 peak, but it won’t return to pre-2020 levels. The “new normal” is a higher baseline of ownership.
- Diversification: We will see more Class B and small towables as the primary growth engines.
- Technology: Expect more integration of smart home tech, solar, and energy efficiency as the demographic shifts toward younger, tech-savy buyers.
- Sustainability: With the rise of Green RVing, we’ll see more manufacturers focusing on eco-friendly materials and off-grid capabilities.
As we mentioned in the “First Video” summary, the question remains: Should RV owners sell or hold? With gas prices rising and the market stabilizing, the answer depends on your personal goals. If you bought in 2021 at a premium, holding might be the best financial move. If you bought in 2019, you might be sitting on a goldmine.
But one thing is certain: the RV lifestyle is here to stay. The 2021 boom proved that Americans crave the freedom of the open road, and no amount of supply chain issues can stop that desire.
🧠 Conclusion

The year 2021 was a watershed moment for the RV industry. It wasn’t just a year of record numbers; it was a year of transformation. From the explosion of Class B van sales to the influx of first-time Millennial owners, the industry proved its resilience and adaptability.
While the supply chain challenges of 2021 created headaches for buyers and dealers alike, they also highlighted the enduring appeal of the RV lifestyle. Whether you are a full-time RVer, a weekend warrior, or just dreaming of hitting the road, the data from 2021 tells us one thing: The road is calling, and it’s louder than ever.
If you are considering joining the ranks of the 1.2 million households that own an RV, now is a great time to start your research, even if the market has cooled slightly from the 2021 frenzy. The lifestyle offers freedom, adventure, and a connection to nature that is hard to beat.
Final Recommendation:
- For First-Timers: Look into Class B or small travel trailers. They offer the best balance of affordability and maneuverability.
- For Families: Class C or Fifth Wheels provide the space you need without the complexity of a Class A.
- For Full-Timers: Consider Park Models or high-end Fifth Wheels with robust off-grid capabilities.
Don’t let the 2021 panic scare you off. The market is stabilizing, and the opportunities to find your perfect rig are better than they were during the peak of the frenzy.
🔗 Recommended Links
Ready to start your journey? Here are some top resources and places to find your dream RV:
- 👉 Shop Class B Vans: RVShare Class B Search | Camping World Class B | Winebago Official
- 👉 Shop Class C Motorhomes: RVShare Class C Search | Camping World Class C | Thor Motor Coach Official
- 👉 Shop Travel Trailers: RVShare Travel Trailers | Camping World Travel Trailers | Jayco Official
- 👉 Shop Fifth Wheels: RVShare Fifth Wheels | Camping World Fifth Wheels | Keystone Official
- Books on RVing: The Complete Guide to RVing on Amazon | Full-Time RVing on Amazon
❓ FAQ

What is the growth rate of the RV industry in 2021 compared to previous years?
In 2021, the RV industry saw a 39.5% increase in wholesale shipments compared to 2020, surpassing the previous record set in 2017 by 19%. This represented a massive surge in demand driven by the pandemic.
Read more about “🚐 2020 RV Statistics: The Shocking Truth Behind the Boom & Fire Risks”
What are the most common amenities in RVs in 2021?
Due to the rise in remote work and full-time living, common amenities in 2021 included dedicated office spaces, high-speed Wi-Fi boosters, solar power systems, larger kitchens, and enhanced insulation for four-season use.
How many people own an RV in the United States as of 2021?
As of 2021, approximately 1.2 million US households owned an RV. Additionally, 9.6 million households expressed an intent to purchase one in the next five years.
Read more about “📉 RV Market Crash 2026: 7 Signs It’s a Correction, Not a Collapse”
What are the top RV destinations in 2021?
The Great Smoky Mountains National Park was the top destination, followed by Yosemite, Death Valley, Olympic, and Zion. These parks saw record-breaking RV visitation numbers.
What is the average cost of an RV in 2021?
Prices varied widely by type. Pop-up campers averaged around $16,90, while Class B motorhomes averaged $134,0, Class C around $148,0, and Class A motorhomes could reach $375,80. Note that these are averages, and prices fluctuated due to supply chain issues.
Read more about “🚨 RV Industry Outlook 2026: Sellers Desperate, Buyers Feast!”
How many RVs were sold in 2021 in the United States?
The industry produced a record 60,240 wholesale RVs in 2021. This figure represents the number of units shipped to dealers, which is the standard metric for industry output.
Read more about “🏆 What State Has the Most RVs? The 2026 Rankings Revealed”
What are the most popular types of RVs in 2021?
Towable RVs were the most popular, accounting for 90.64% of shipments. Within motorhomes, Class B (Van Campers) saw the highest growth rate at 91.5%.
Read more about “📈 The Ultimate RV Statistics Graph Guide (2026)”
Is the RV business growing?
Yes, the RV business experienced significant growth in 2021, with a 39.5% increase in shipments over 2020. While the market may stabilize, the long-term outlook remains positive due to demographic shifts and lifestyle changes.
Read more about “17 Essential RV Lifestyle Tips for 2025 🚐 Your Ultimate Guide”
What is the current state of the RV industry?
As of the 2021 data, the industry is in a state of high demand with supply constraints. Inventory levels are low, and prices are elevated, but the overall trend is one of sustained interest and growth.
Read more about “🚐 7 Major RV Brand Acquisitions & Mergers Shaping 2026”
What percent of the US population owns an RV?
Approximately 1.2 million households own an RV, which translates to a small but significant percentage of the total US population. However, the number of people interested in owning one is much higher.
Read more about “🚐 What is the Average Age of RV Owners? (2026 Stats)”
What percentage of Americans have an RV?
While exact percentages vary, the data suggests that around 10% of US households have either owned or are interested in owning an RV.
Read more about “🏕️ How Long Does the Average Person Own an RV? (2026 Stats)”
Is RVing slowing down?
While the explosive growth of 2020-2021 may moderate, RVing is not slowing down in the sense of declining interest. Instead, the market is stabilizing at a higher baseline of ownership and usage.
Read more about “📉 Is the RV Industry Declining? 7 Truths for 2026”
What is the current RV sales statistics?
The most recent comprehensive data for 2021 shows 60,240 wholesale shipments. For real-time sales data, industry reports from the RVIA are the best source.
Read more about “📊 RV Statistics 2026: The Shocking Truth Behind the Boom”
📚 Reference Links
- RV Industry Association (RVIA): 2021 RV Industry Produces 60,0 RVs
- Dream Big Travel Far: RV Industry Statistics 2021
- Cleango: 61 RV Industry Statistics & Trends
- Winebago: Official Website
- Thor Motor Coach: Official Website
- Forest River: Official Website
- Jayco: Official Website
- Keystone RV: Official Website
- Newmar: Official Website
- Airstream: Official Website
- RVShare: Search for RVs
- Camping World: Search for RVs